Cocktails
The Data
cocktails <- readr::read_csv('https://raw.githubusercontent.com/rfordatascience/tidytuesday/master/data/2020/2020-05-26/cocktails.csv')##
## ── Column specification ────────────────────────────────────────────────────────
## cols(
## row_id = col_double(),
## drink = col_character(),
## date_modified = col_datetime(format = ""),
## id_drink = col_double(),
## alcoholic = col_character(),
## category = col_character(),
## drink_thumb = col_character(),
## glass = col_character(),
## iba = col_character(),
## video = col_logical(),
## ingredient_number = col_double(),
## ingredient = col_character(),
## measure = col_character()
## )boston_cocktails <- readr::read_csv('https://raw.githubusercontent.com/rfordatascience/tidytuesday/master/data/2020/2020-05-26/boston_cocktails.csv')##
## ── Column specification ────────────────────────────────────────────────────────
## cols(
## name = col_character(),
## category = col_character(),
## row_id = col_double(),
## ingredient_number = col_double(),
## ingredient = col_character(),
## measure = col_character()
## )boston_cocktails %>%
group_by(name) %>%
summarise(Ingredients = n()) %>%
ggplot(., aes(x=Ingredients)) +
geom_histogram(bins = 24, fill="blue") +
theme_economist_white() +
labs(title="How Many Ingredients in a Mr. Boston Drink Recipe?",
caption="#tidyTuesday by @PieRatio")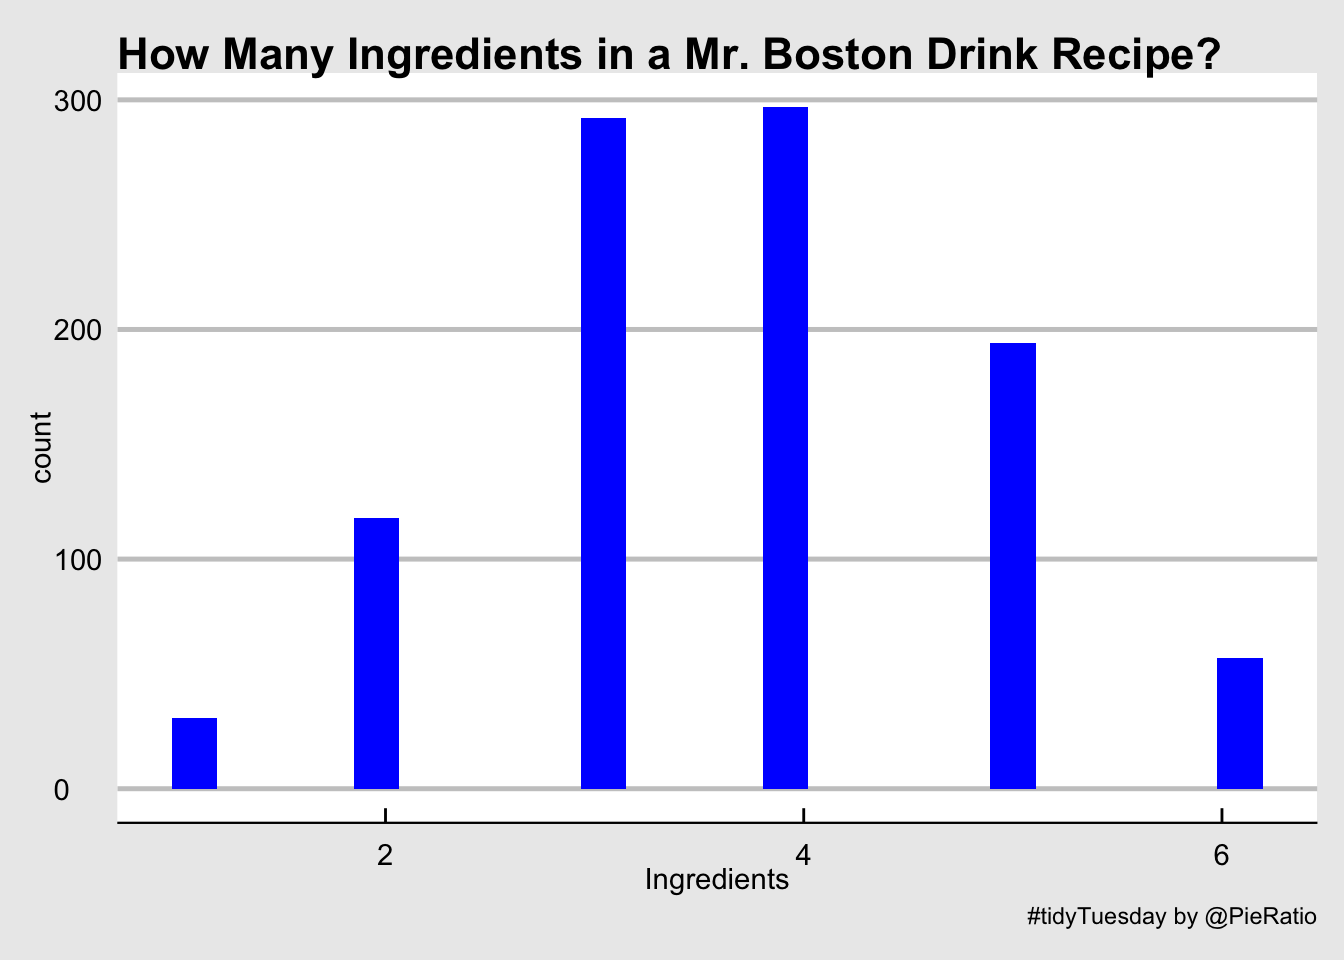
boston_cocktails %>%
  group_by(ingredient) %>%
  summarise(Drinks = n()) %>%
  top_n(30) %>%
  ggplot(., aes(x=forcats::fct_reorder(ingredient, Drinks), y=Drinks, fill=ingredient)) + geom_col() +
  coord_flip() +
  labs(title="How Many Drinks by Ingredient for Mr. Boston?",
       caption="#tidyTuesday by @PieRatio", x="") +
  scale_fill_viridis_d() +
  guides(fill=FALSE)
## Selecting by Drinks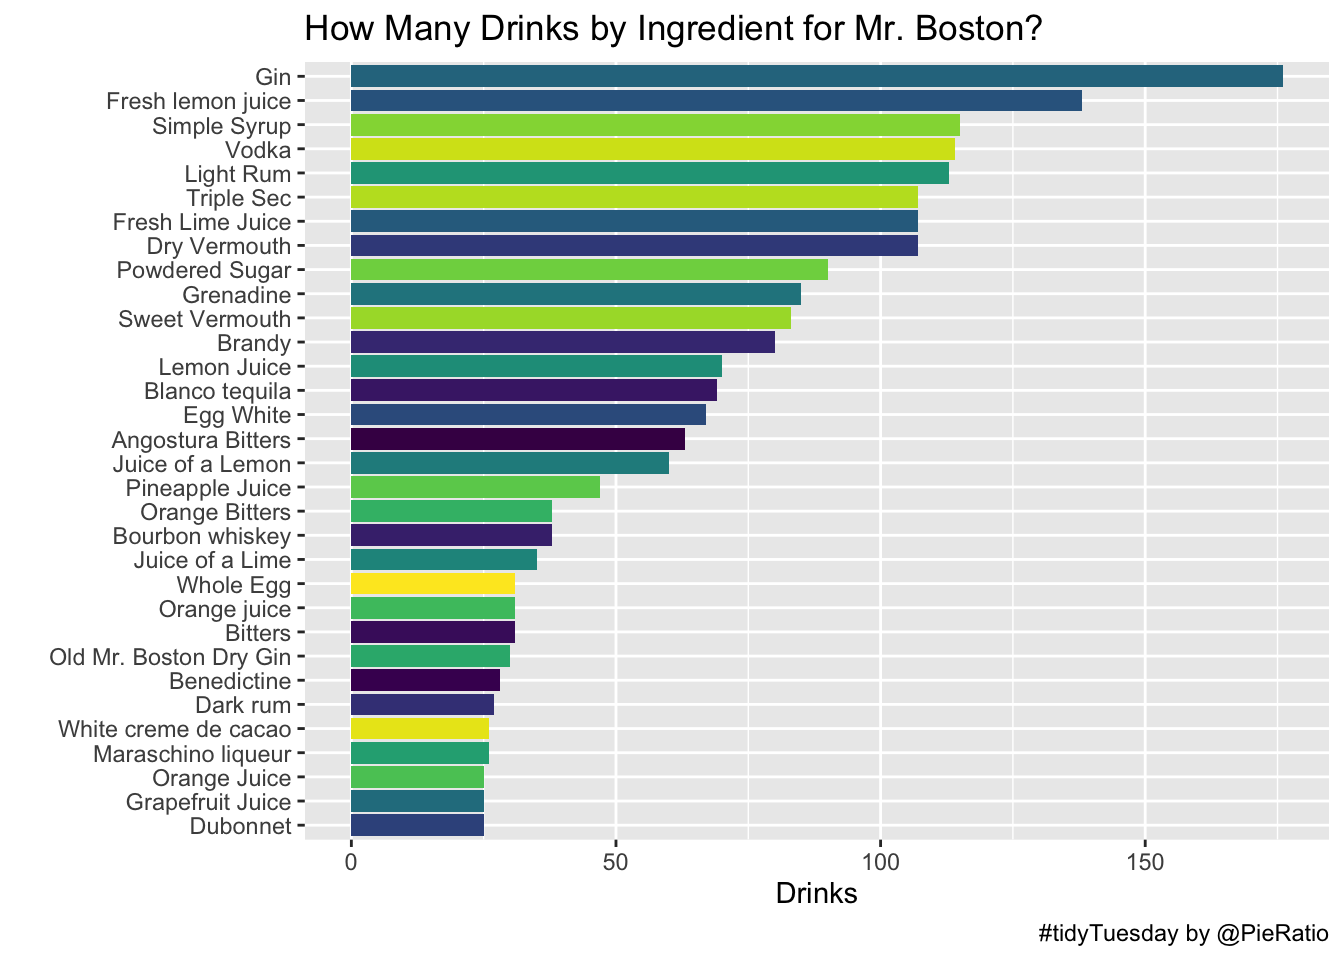
Robert W. Walker
Associate Professor of Quantitative Methods
My research interests include causal inference, statistical computation and data visualization.