Employment
R Markdown
You will need to create a FRED api login.
library(fredr); library(tidyverse); library(fpp3)## ── Attaching packages ─────────────────────────────────────── tidyverse 1.3.0 ──## ✓ ggplot2 3.3.3 ✓ purrr 0.3.4
## ✓ tibble 3.0.6 ✓ dplyr 1.0.4
## ✓ tidyr 1.1.2 ✓ stringr 1.4.0
## ✓ readr 1.4.0 ✓ forcats 0.5.1## ── Conflicts ────────────────────────────────────────── tidyverse_conflicts() ──
## x dplyr::filter() masks stats::filter()
## x dplyr::lag() masks stats::lag()## ── Attaching packages ────────────────────────────────────────────── fpp3 0.3 ──## ✓ lubridate 1.7.9.2 ✓ feasts 0.1.6
## ✓ tsibble 0.9.3 ✓ fable 0.3.0
## ✓ tsibbledata 0.2.0## ── Conflicts ───────────────────────────────────────────────── fpp3_conflicts ──
## x lubridate::date() masks base::date()
## x dplyr::filter() masks stats::filter()
## x tsibble::interval() masks lubridate::interval()
## x dplyr::lag() masks stats::lag()NFP <- c("PAYNSA","PAYEMS") %>% map_dfr(., fredr_series_observations) %>% mutate(YM=yearmonth(date)) %>% as_tsibble(., index=YM, key=series_id)Seasonal Adjustment?
NFP %>% filter(YM > yearmonth("2019-01")) %>% autoplot() + labs(y="Employment in Thousands")## Plot variable not specified, automatically selected `.vars = value`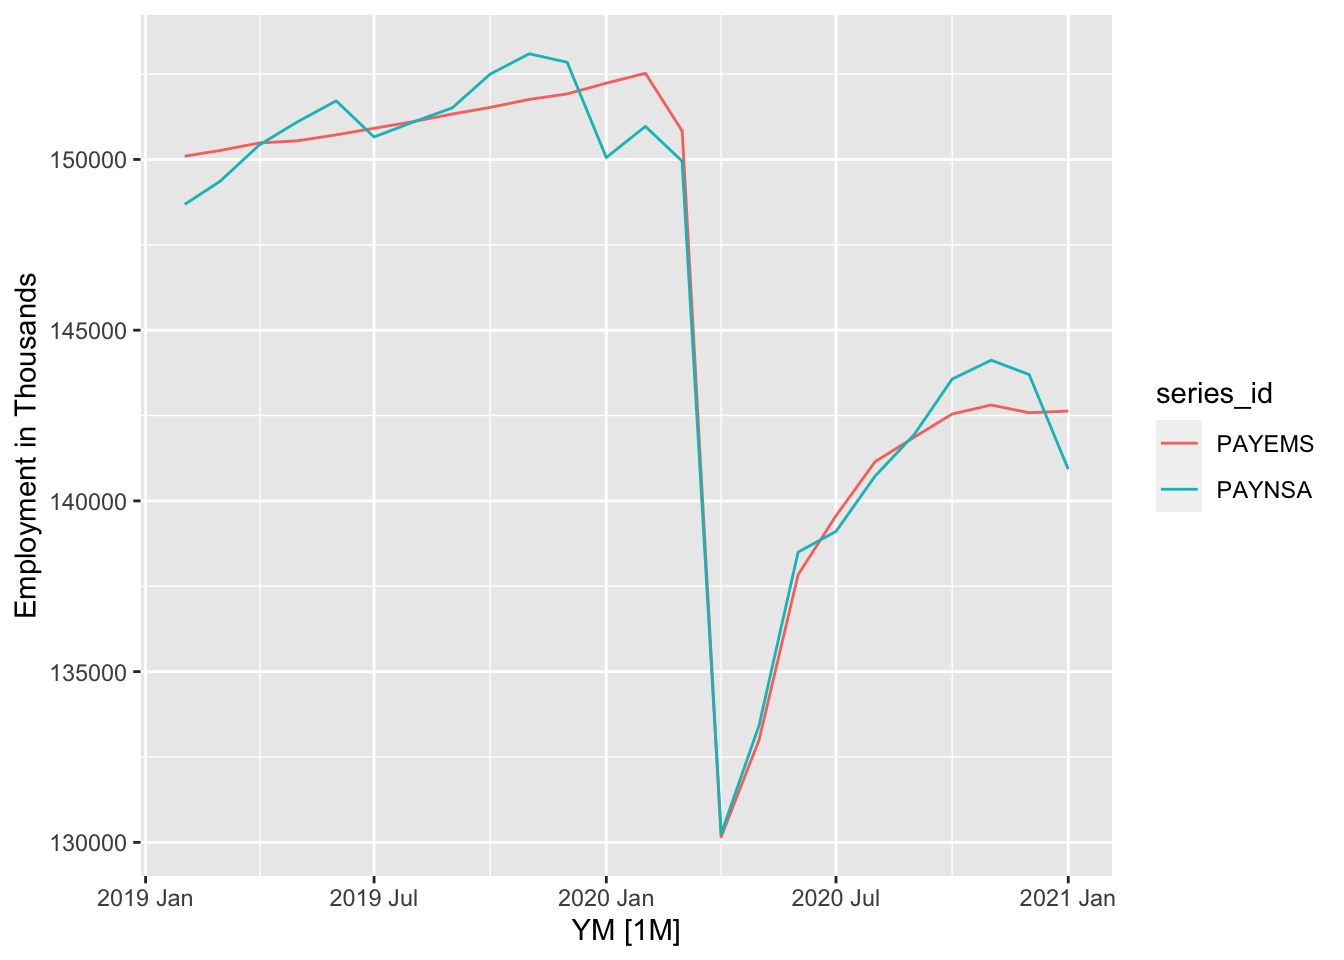
Robert W. Walker
Associate Professor of Quantitative Methods
My research interests include causal inference, statistical computation and data visualization.